The growing popularity of electric vehicles (EVs) has, naturally, led to a corresponding increase in the need for effective EV charging management analytics. In fact, it’s never been more important for business owners to understand the various factors that can affect the efficiency, cost-effectiveness, and possible revenue streams of their EV-charging operation.
In this article you will learn more about the features included in the Spirii Connect Dashboard.

Dashboard overview
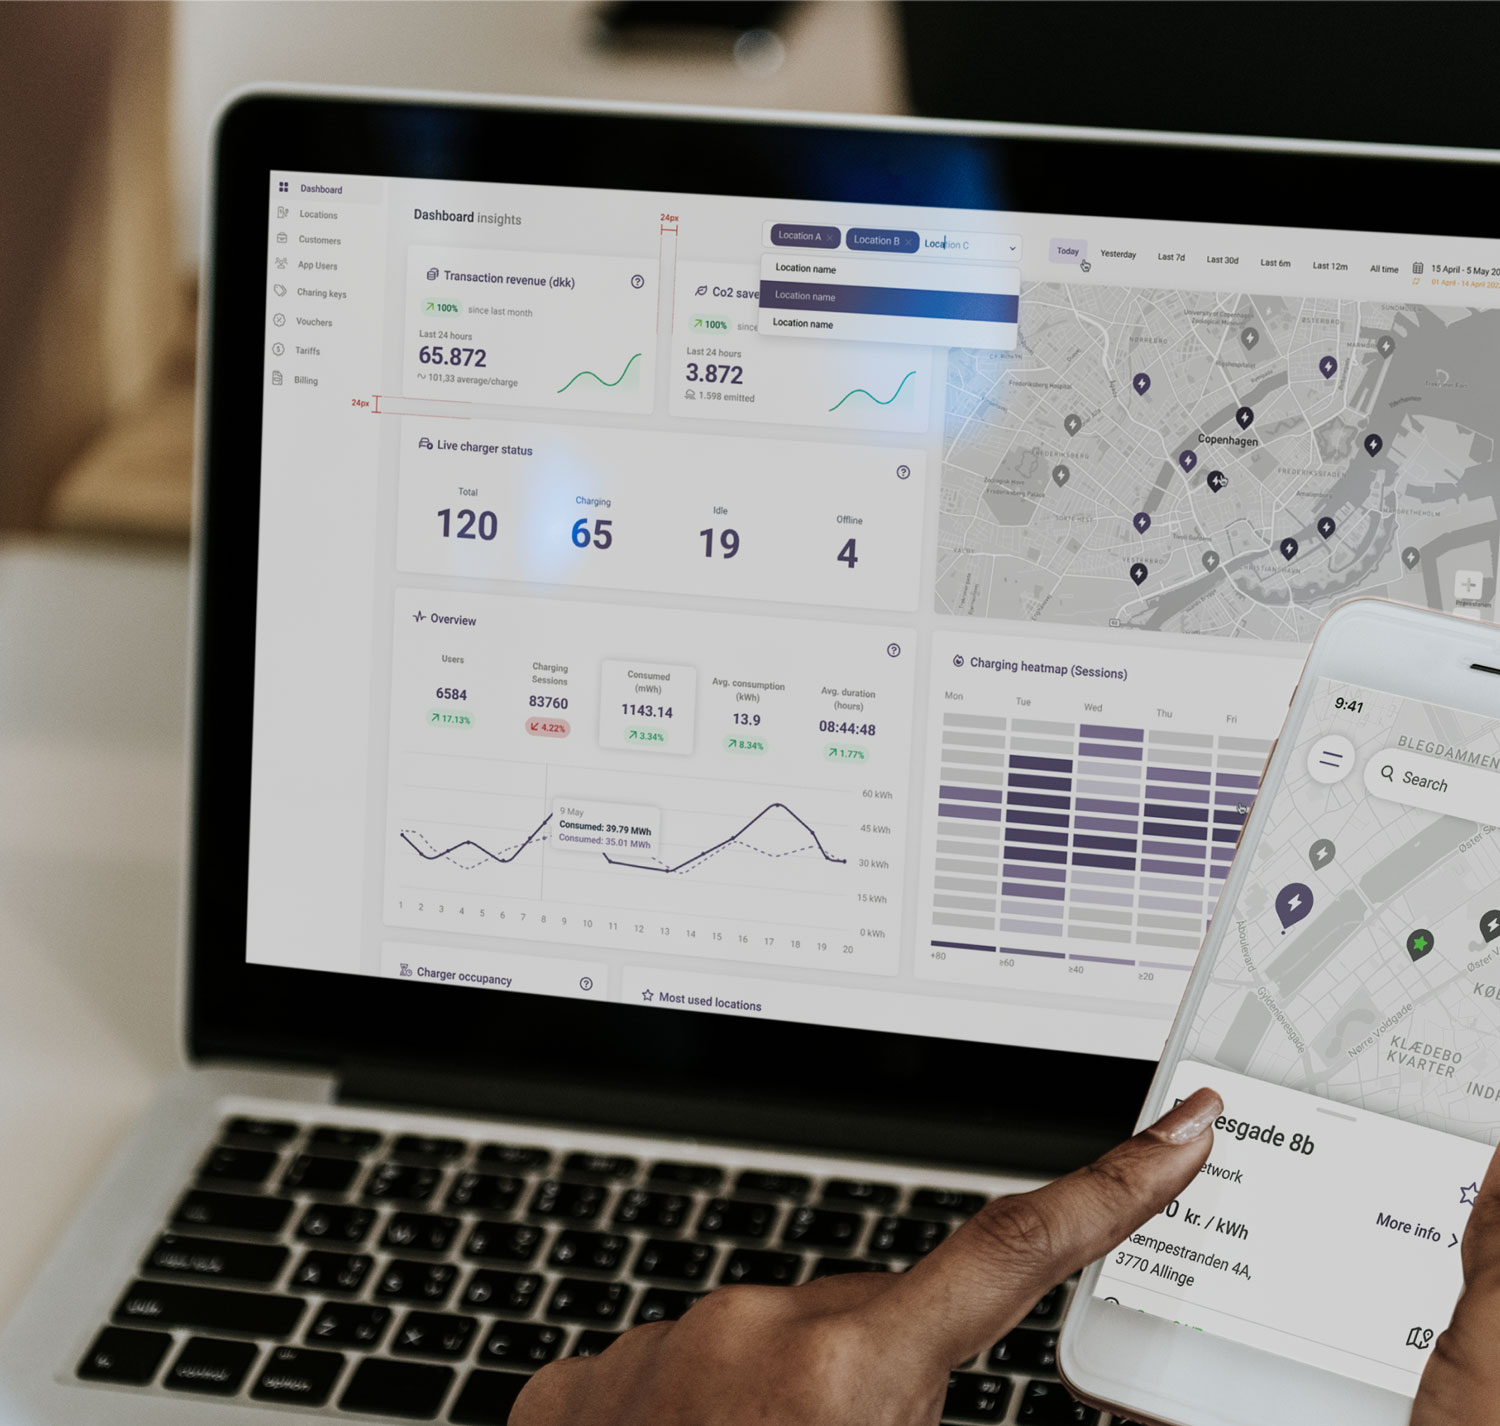
The Dashboard is the nerve center of your charging business. It provides a comprehensive overview of all charging stations under your control, with at-a-glance metrics like charging location occupancy and energy consumption, as well as more granular data such as usage patterns and charging location performance.
This rich insight gives you the ability to make informed decisions about your charging infrastructure, all from one spot.
In Spirii Connect Dashboard you will find:
In the dashboard you’ll find:
- Transaction revenue
- Charging heatmap and occupancy (showing when your chargers are most used)
- Live charger status – how many chargers are live or offline, alongside idling time
- Amount of CO2 saved
An overview of:
- Active users
- Most used locations
- Average consumption
- Average charge duration
These Dashboard features can help you run a frictionless EV business wherever you go. Effective EV charging management analytics can help streamline your business, ensuring that charging data is tracked and analyzed correctly.
With Spirii Connect, you can be sure that your EV charging operations remain efficient, profitable, and reliable.

